You're looking at a table on a webpage. It has the data you want, prices or rankings or schedules, but the site doesn't offer a download. Maybe the page is behind a login wall, maybe the CSV link is broken, maybe the table is rendered as an image. You need this as rows and columns in a spreadsheet, and copy-pasting cells one by one is going to take twenty minutes.
This happens to us constantly. Comparison sites, sports rankings, real-estate listings, government data portals, niche forums, leaked PDFs. Anywhere a table exists but isn't downloadable. The shape of the table is right there on screen. The information is right there. There's just no easy way to get it into a usable format.
Until recently the answer was either "type it out" or "open DevTools and try to scrape the HTML." Both are slow and neither works when the table is a screenshot or a PDF page. With AI, you can capture the table as an image and have it returned as CSV in about ten seconds.
Capture the table
Open the page that contains the table. Click the VZLyze icon in your toolbar and capture either the full page or a drawn region around the table specifically. For a long table, the region capture is usually cleaner, because you don't need rows you don't want, and you don't need site chrome around the data.

The example above is a sports ranking table with clear headers, one row per record, the kind of data that's a pain to retype. Any table with a similar structure will work.
Run the analysis, then choose "Extract as CSV"
Click Analyze on the capture. The AI reads the screenshot and returns a short written summary of what's in it. That summary on its own is useful (it gives you context, an executive summary, key observations) but the part that matters here is the button that appears underneath the analysis: Extract as CSV.
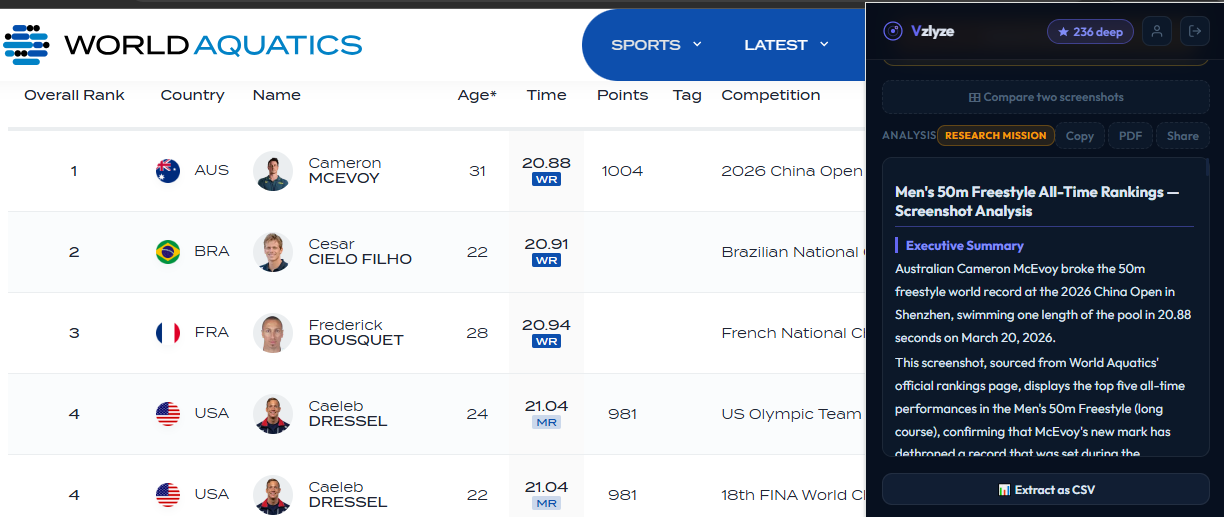
VZLyze shows that button when it detects tabular data in the capture. If the screenshot doesn't contain a table, the button doesn't appear, which keeps things tidy. Click it, and the AI re-reads the image with one job: turn every row and column into CSV.
Open it in a spreadsheet
The CSV opens directly in Google Sheets in a new tab. No download, no save dialog, no copy-pasting. Headers in row 1, data from row 2 down.
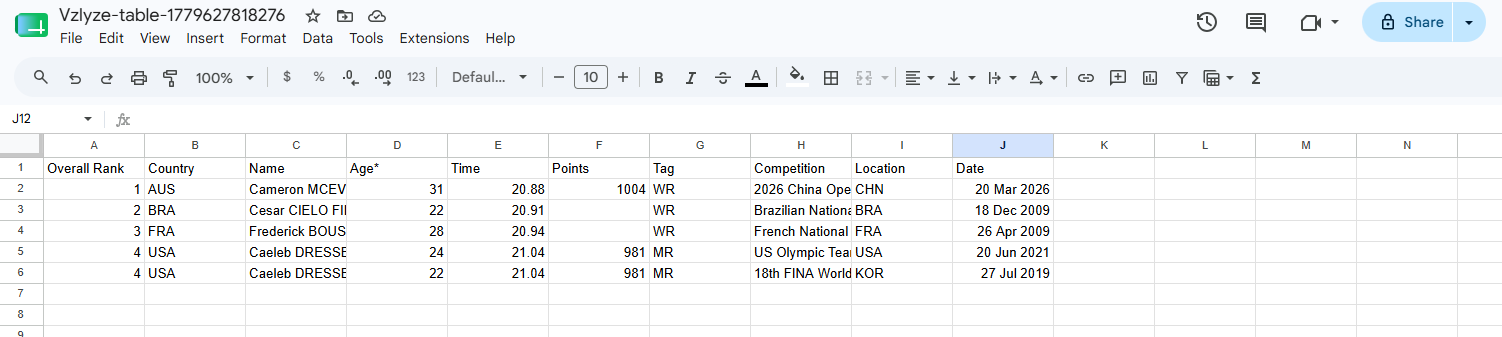
From there you do whatever you do with a spreadsheet: sort, filter, pivot, chart, or just download it as Excel or CSV and use it somewhere else. Total time from "look at table in browser" to "have a working spreadsheet" is under thirty seconds for most tables.
Why this is better than scraping or retyping
There are a few reasons we keep reaching for this over the alternatives. The first is that it works on anything visible. Image tables, PDF tables, tables on logged-in pages, tables on sites that block scraping, tables in a screenshot someone Slack'd you, tables in a presentation. If you can see it, you can capture it. (For pages of body text inside the same image, the Extract Text flow handles the prose half.)
It also handles formatting that breaks normal scrapers. Merged cells, blank cells, footnotes inside a cell, units of measurement, currency symbols, flag icons, profile photos in a name column. The AI reads structure the way you do, not the way the DOM does.
And it's faster than DevTools. Even for someone who knows how to open the inspector and dump table contents into the console, the AI flow is usually quicker. No code, no figuring out which selector matters.
Where it falls short
We've thrown a lot of tables at this. There are patterns where the output needs cleanup, or where it's the wrong tool entirely.
Very long tables are the most common headache. If a table runs hundreds of rows past what's visible on screen, you'll need to capture it in chunks, or use the full-page capture if the whole table is on one HTML page. The AI reads what's in the image and can't scroll for you.
Tables inside heavy backgrounds (low contrast, watermarks, or busy graphics behind the cells) confuse cell boundaries. Crop tightly to the table itself when you can. Complex nested headers (two or three rows of grouped headers like "Q1 / Sales / North America") usually come out flat, so you may need to manually re-merge the header row.
Two cases where it's just the wrong tool. Charts and graphs aren't tables. Extracting numbers from a bar chart is a different problem, since the values aren't written down anywhere. And hand-drawn tables (a grid sketched on a whiteboard or napkin) work less reliably than printed or digital tables. For those, the handwriting flow is a better fit since it expects messy human input.
A few real use cases
Things we've used table extraction for recently:
- Pulling a competitor pricing matrix out of a PDF a sales rep sent over, so we could sort it and run our own analysis.
- Grabbing fantasy sports stat tables off a site that doesn't publish a CSV.
- Converting a screenshot of a meeting agenda (someone pasted an image of a table into Slack) into a real list of tasks with owners.
- Lifting product specs out of a manufacturer's PDF datasheet for a side-by-side comparison.
- Building a dataset from research papers where the table only appears as a figure.
None of these have a good "official" export path. The table just exists as pixels somewhere. Now those pixels become rows and columns in about as much time as it takes to read this sentence.
Try it on a table you've been avoiding
VZLyze is free to install. Extract as CSV works on Free, Starter, Pro, and Business. One credit per extraction — Quick on Free/Starter, Deep on Pro/Business.
Get VZLyze for Chrome